
Understand Cell Safety in Unprecedented Detail
Fully understand the thermal runaway behaviour of your battery cells, using our proprietary DATRC method.
Fingerprint the Cell Safety Behaviour of Any Cell
Our proprietary test method quantifies the thermal runaway event of a cell, independent of chemistry, format, or size.
Use Cases For Every Engineer
No matter the role: If safety and comparing battery cells is part of your job, DATRC makes it easier and faster.
Cell
Engineers
Compare cell safety using quantitative data, independent of format, chemistry, or other factors
Understand the safety impacts of chemistry tweaks and mechanical design changes
Identify critical aspects of the selected cell early on
Pack
Engineers
Select the optimal cell early on and inform design decisions based on the specific cell
Understand failure modes of the cell and identify the worst case
Size thermal management, propagation protection, and venting provision
QA
Engineers
Monitor production quality and product safety
Understand batch-to-batch variation of produec or received cells
Validate conformance with cells that were used for certification
DATRC Measures All Relevant Properties
Each experiment determines the relevant properties that characterise the cell behaviour.
-
Total energy released in the thermal runaway event
Energy fraction remaining in the cell
Energy fraction released with the ejected gas and solid particles
-
Total amount of gas produced by the thermal runaway reaction
Vent gas temperature
Amount of solids ejected from the cell and their size distribution
-
Vent gas release rate during the thermal event, both average and peak rate
Solids release rate, both average and peak rate
Time-dependent profiles for vent gas release, solids release, and cell mass loss

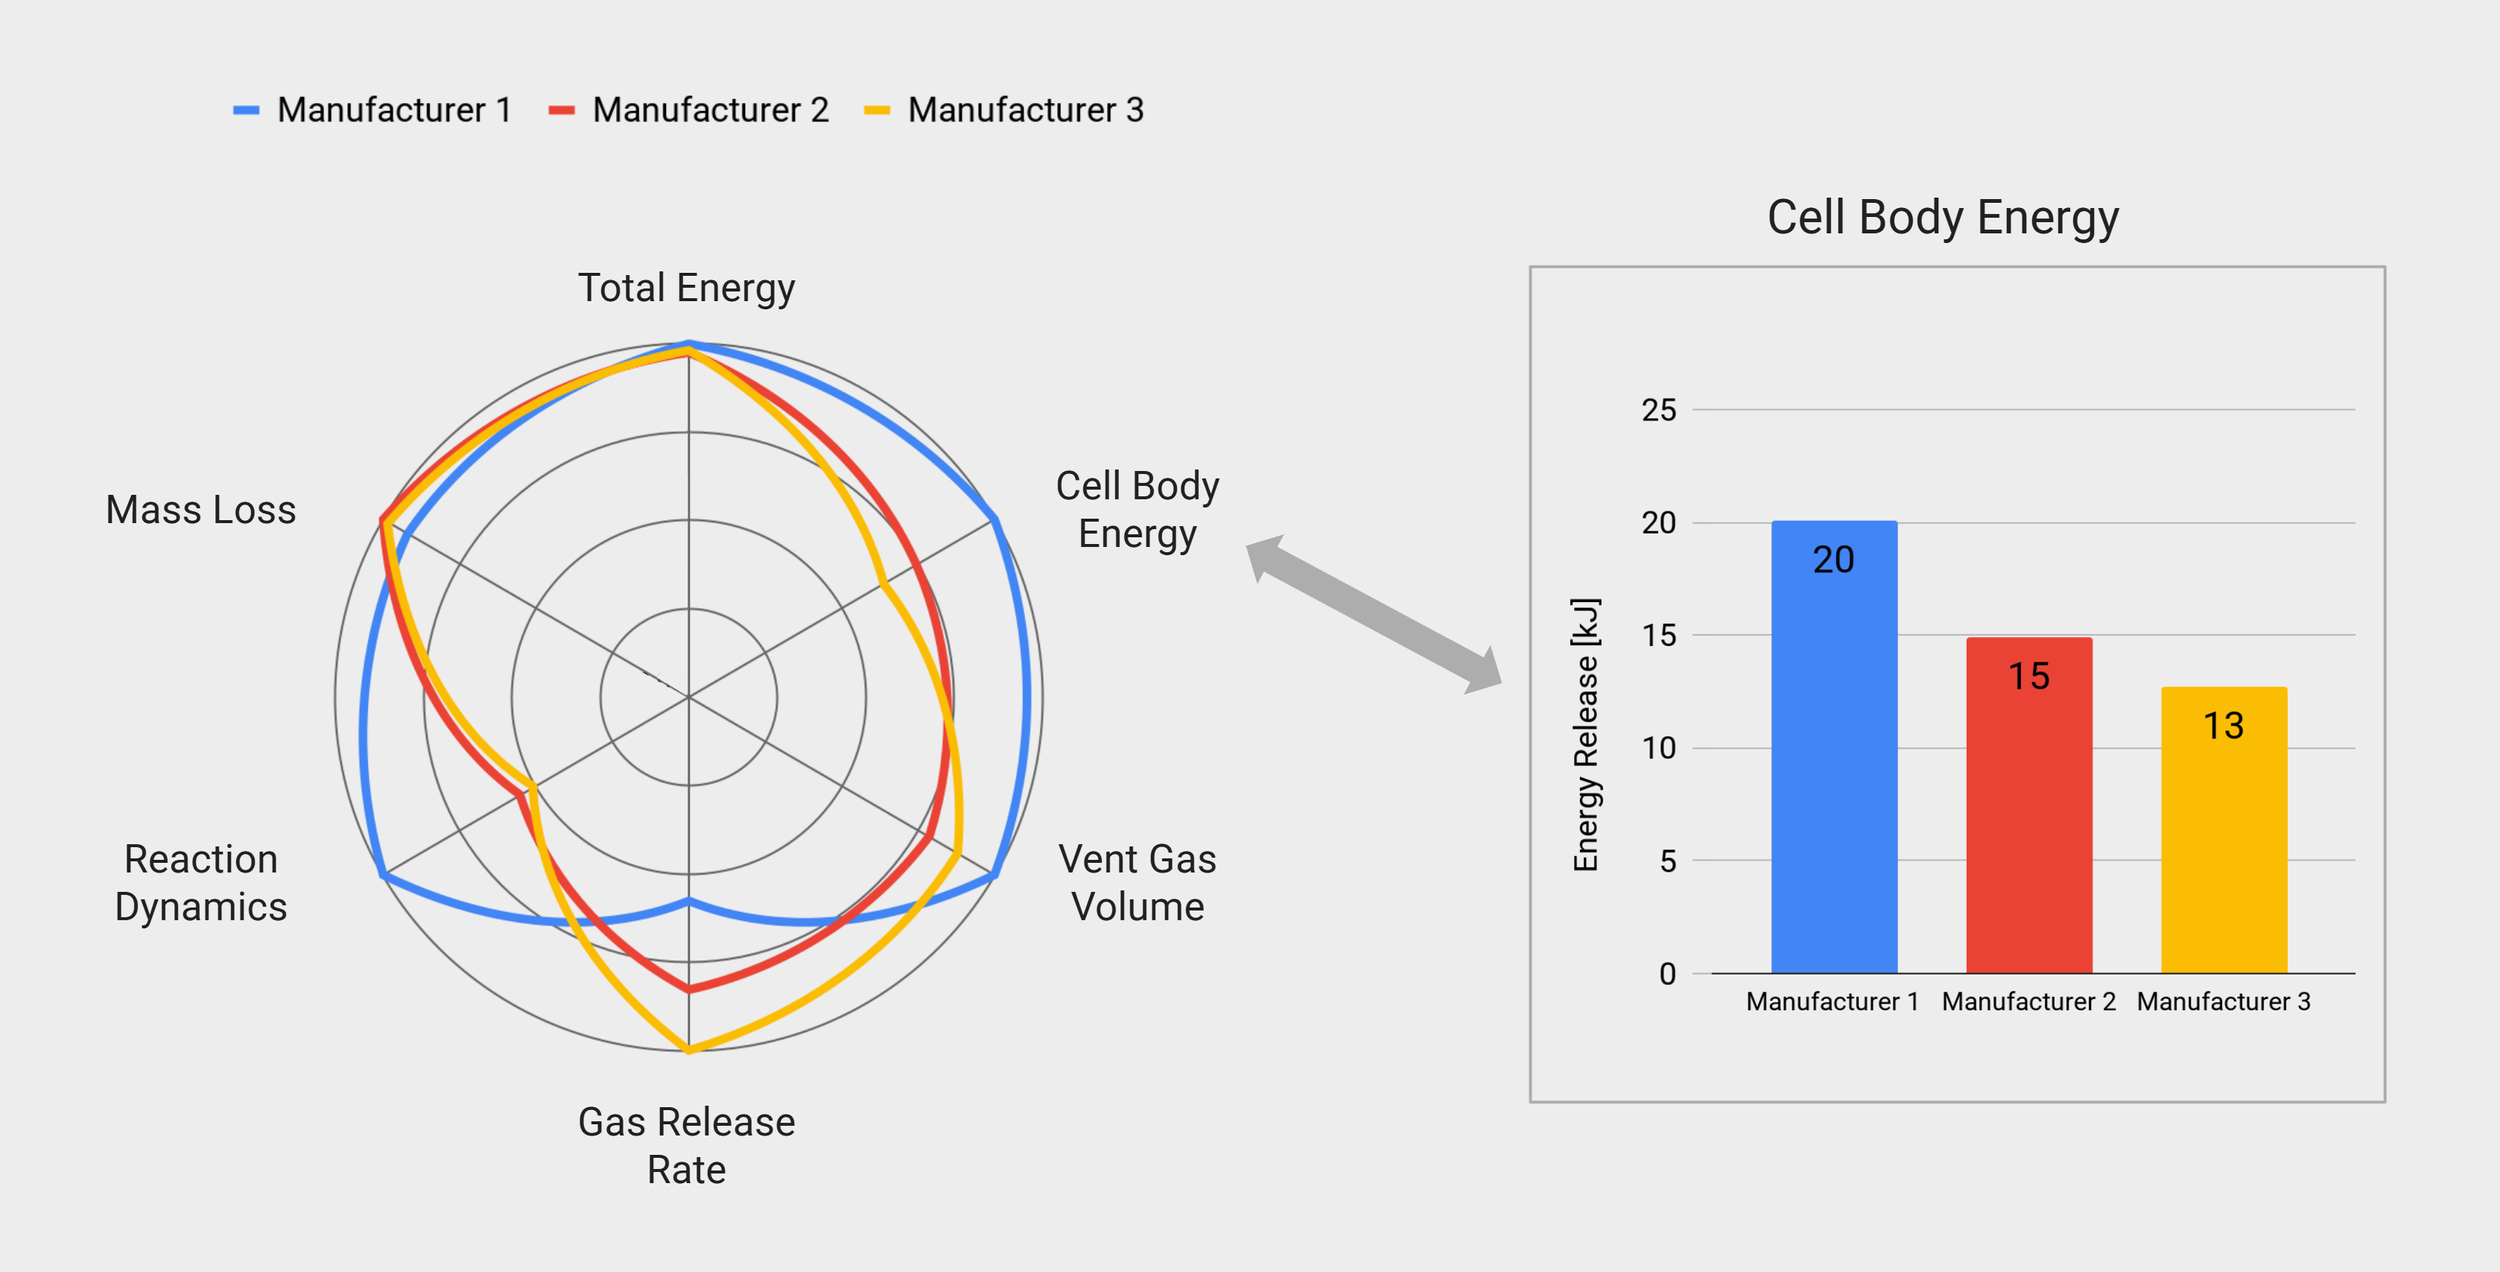
Similar Cells, Different Safety Behaviour
Explore the safety behviour of three electrically similar cells with different thermal runaway event, using this interactive example.
Experiment Details
Data for 2170 cells from three manufacturers.
4.9 Ah each, similar performance.
Average values for three repeats per type (nine cells in total)
Triggered by overheating with 10 °C/min.
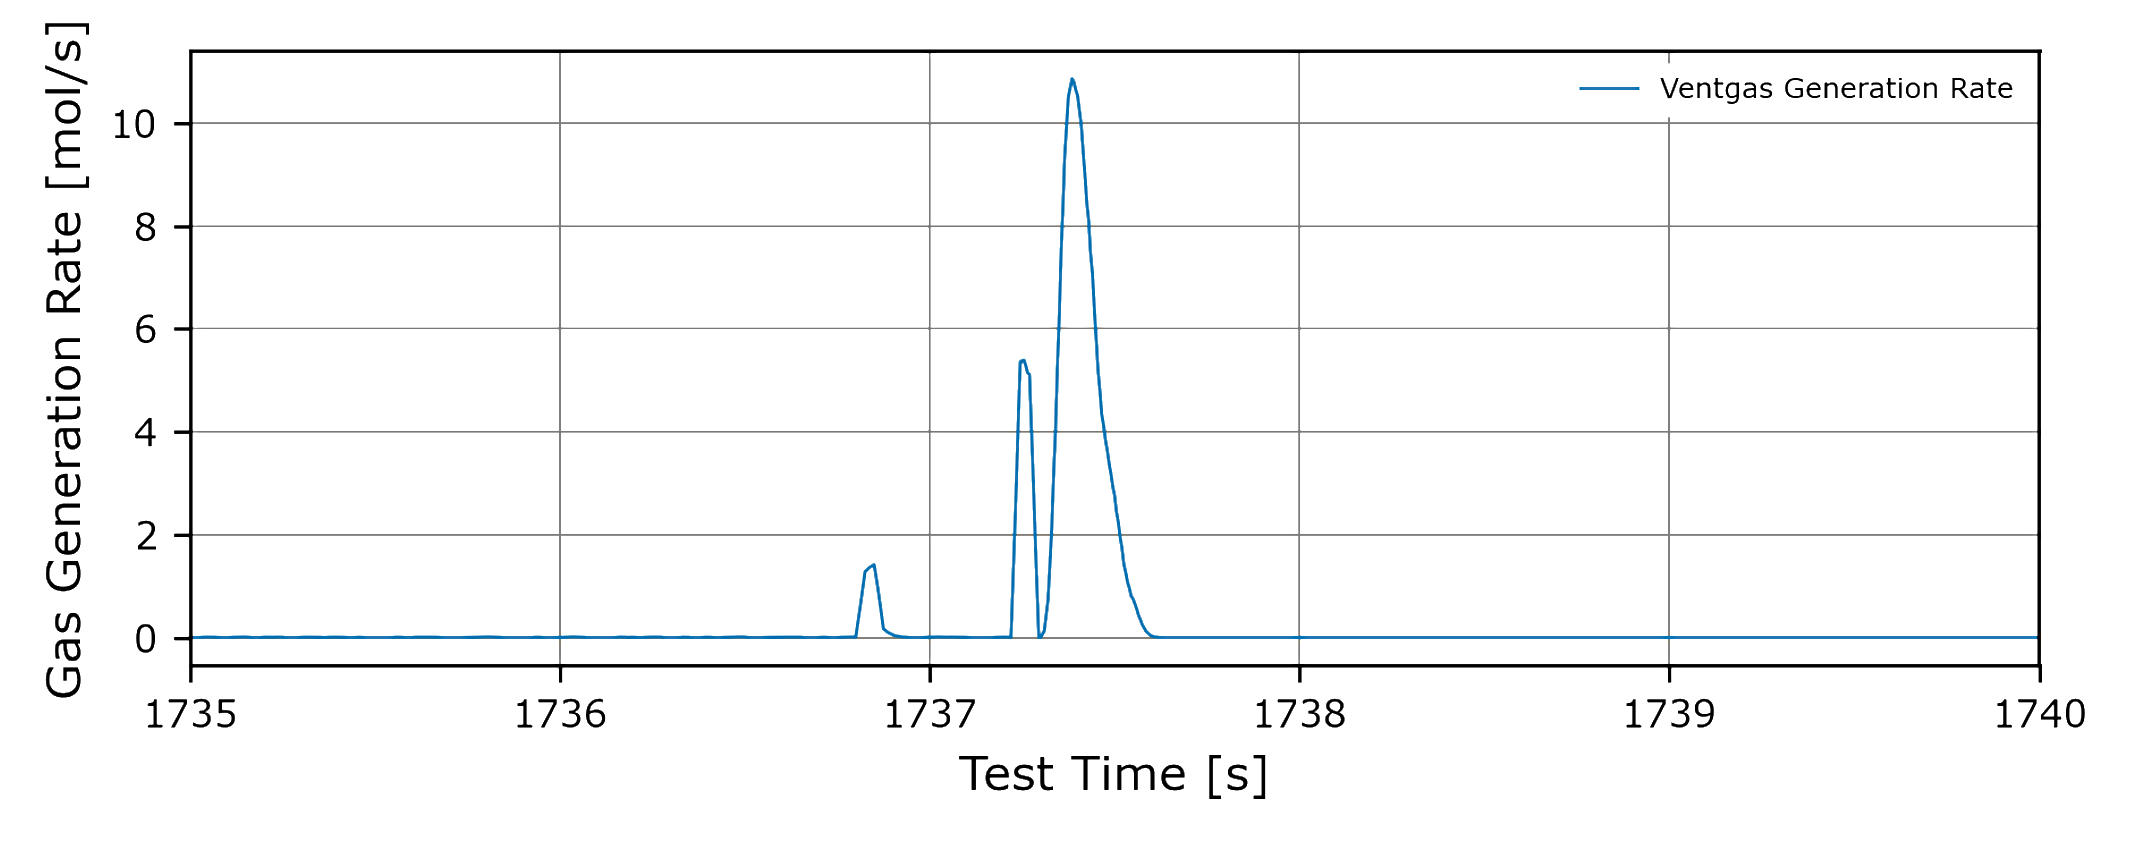
Understand Dynamic Thermal Runaway Behaviour
Determine the dynamics of the thermal runaway reaction, by extracting the gas release and mass loss profiles.
Understand Safety-Critical Edge Cases
DATRC enables objective comparison of different cells, enabling the rapid analysis of changes in safety behaviour.
Lithium
Plating
By comparing the DATRC results of pristine and lithium-plated cells, the effects on safety can be understood early in development.
Cell Ageing
& SOH
By comparing the energy and gas released of pristine and aged cells, expensive safety testing on module/pack level can be avoided.
Vent Gas
Combustion
By executing DATRC tests in both air and inert gas, the effect of vent gas combustion with atmospheric oxygen can be determined empirically.
Complexity Based on Your Requirements
Tailor the experimental detail to your needs - from basic understanding of the cell behaviour to full characterisation.
| Baseline Screening | Dynamics Deep-Dive | Precise Modeling | ||
| TR Onset Temperature | °C | Included | Included | Included |
| Cell Surface Temperature | °C | Included | Included | Included |
| Vent Gas Temperature | °C | Included | Included | Included |
| TR Calorimetry: Cell Energy Fraction | J | Included | Included | Included |
| TR Calorimetry: Ejecta Energy Fraction | J | Included | Included | Included |
| TR Reaction Profile | W | — | Included | Included |
| Total Vent Gas Volume | L or mol | — | Included | Included |
| Vent Gas Release Rate | L/s | — | Included | Included |
| Cell Mass Loss Rate | g/s | — | Included | Included |
| Ejecta Heat Capacity | J/kg·K | — | — | Included |
| Ejecta Particle Size Analysis | - | — | — | Included |
Experimental Details
The experimental conditions used in other battery abuse tests can be replicated in DATRC, enabling direct comparison of the results.
Limits
Cells up to 250 Ah
All chemistries, including NMC, LFP, Na-ion, etc.
All formats (cylindrical, single-layer and multi-layer pouch, prismatic)
Triggers
Nail penetration
Overheating: Local hotspot or full-cell
Electrical abuse: Short circuit, overcharging, forced discharge, etc.
Test Environment
Air
Inert atmosphere (argon, nitrogen)
Temperature control
Can’t find what you are looking for? Contact us to discuss your individual test!
Download Our Example Dataset
Want to find out more? Download an example dataset for a 21700 cell by fillingin the form below.